Home
Great Shift Table of Contents/Summary
Preparing Yourself No
Catastrophic Earth Changes
Your Soul Origins About
Russell Newsletter
Contact Us
![]()
Earth Changes Data Graph #1
Frequency of of Moderate and Very Strong Earthquakes.First Posted August 12, 2005
Updated January 3, 2009
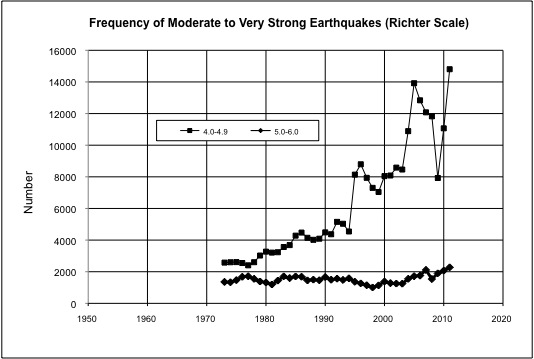
Updated June, 2012The previous page plots changes in the frequency and intensity of major earthquakes (6.1 and greater). I performed this search of the USGS NEIC database not sure exactly what I would find. Two categories are plotted: (1) 5.0 to 6.0 (strong to very strong on the Mercalli scale--strong enough to scare you but not likely to cause serious damage, and (2) 4.0 to 4.9 (moderate to rather strong on the Mercalli scale--noticeable but probably not big enough to really scare you).
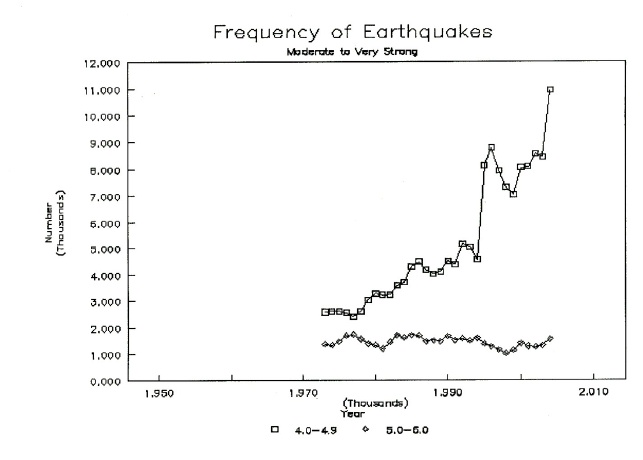
The first category has remained stable since 1973 ranging from around 1,000 to 1,700 a year and averaging around 1400. I was blown away as the plot for the moderate to rather strong category emerged. It gradually increased from around 2,500/yr in the 1970s to around 5,000/yr in the early 1990s. Since 1994 the number has skyrocketed reaching a high of almost 14,000 in 2005 and staying in the 12,000 to 13,000 range since.
In terms my hypothesis of human consciousness minimizing harm from geophysical stresses, what seems to be happening is that additional stresses not released by major earthquakes are being relieved primarily through lower intensity earthquakes. Here the issue isn't so much minimizing physical harm as minimizing emotional harm.
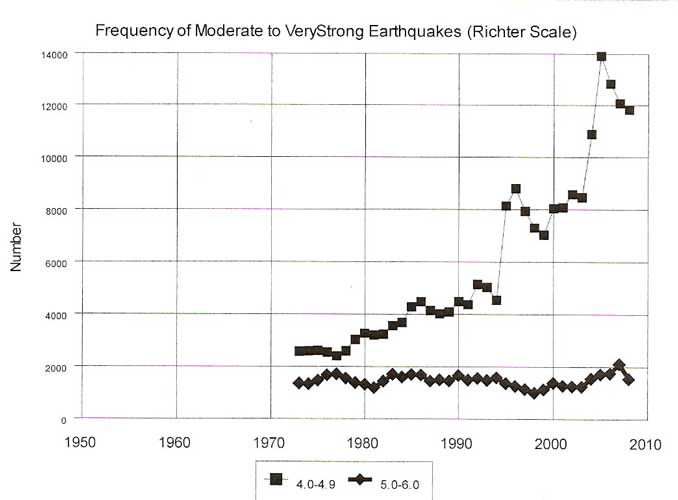
Here is the updated graph. The numbers for 2008 are prelmininary (I prepared this graph on January 2 and when I checked the next day another earthquakes had been added on the 4.0 to 4.9 range).
Update, June 2012. The frequency of very strong earthquakes (5.0 to 6.0) has held pretty steady since the mid-1970s with perhaps a slight upward trend. Updating the global frequency of moderate earthquakes was hampered by the fact that in 2009 USGS stopped reporting earthquakes in the range of 4.0 to 4.4 outside the U.S. I have estimated the global total by calculating the average ratio of earthquakes in the 4.0 to 4.4 range to total earthquakes in the 4.0 to 4.9 range for the period 2000 to 2008 and used this ratio to estimate for the total number in the 4.0 to 4.9 range globally from the USGS data. The overall trend continues to be upward with 2011 posting a record high of about 14,800, almost six times more than the number in the mid 1970s.